Quick Answer: Seismographs detect earthquakes by sensing ground vibrations with a suspended mass that stays still while the ground moves beneath it. This movement is turned into electrical signals and displayed as a seismogram, helping scientists identify the quake’s strength, type of seismic waves, and location.
Spark of a Quake: The Seismograph’s First Response
When an earthquake begins, the ground moves almost instantly. A seismograph springs into action the moment these ground motions, called seismic waves, arrive. Even the tiniest tremors can trigger its sensors—much like how a microphone picks up the faintest whisper.
These instruments are so sensitive that they record not just big, destructive quakes, but also faint rumblings from thousands of miles away. The “spark” here is just the quiet but precise detection of motion long before people notice it.
The Inertia Principle: Capturing Ground Motion
Seismographs operate on a wonderfully simple and reliable idea: inertia. A suspended mass—often part of a pendulum or mass-spring system—wants to stay still, while the ground and the frame of the instrument move with the shaking Earth. The relative motion between the ground and the stationary mass is the key to detecting quakes.

- The frame of the seismograph moves up, down, or side-to-side with the Earth.
- The suspended mass resists this movement due to inertia.
- Relative movement between the two is measured by a sensor (mechanical or electronic).
From Motion to Data: Converting Shakes into Signals
The relative movement between the mass and the ground is transformed into electronic signals. In older analog seismometers, a pen would trace wavy lines on paper attached to a moving drum. In modern digital seismographs, this motion is converted into electrical signals and then stored as digital data.

- Electrical signals represent vibration strength and frequency.
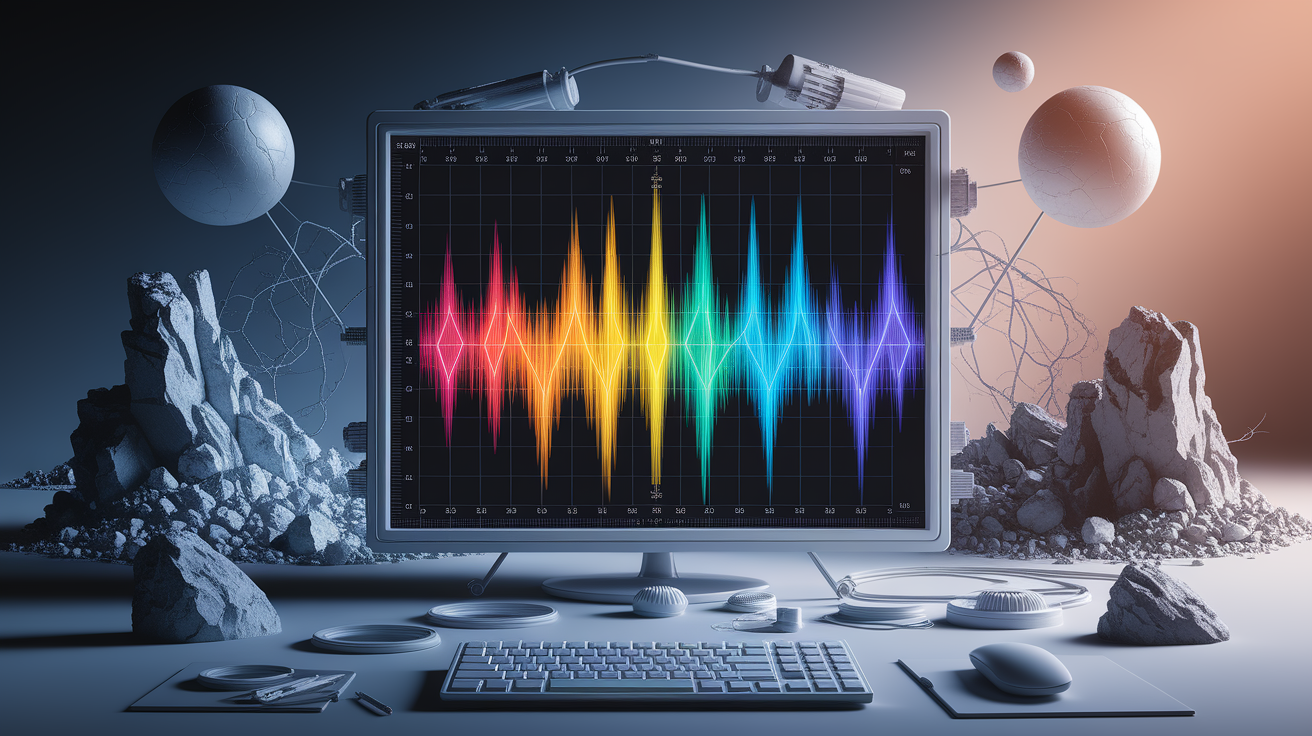
- These signals produce a seismogram — a graph showing the earthquake’s “fingerprint.”
- Digital systems allow instant remote sharing for real-time earthquake monitoring.
Three-Axis Detection: Sensing in All Directions
Earthquakes don’t just shake in one direction. For full accuracy, a seismometer has three sensors to measure vibrations in three perpendicular axes:

- Vertical (Z) – up and down motion
- East-West (E) – horizontal motion in one direction
- North-South (N) – horizontal motion in the other direction
This three-axis recording captures the complete story of ground vibrations, helping seismologists understand the energy and behavior of the quake.
Decoding Seismograms: Identifying Seismic Waves
Seismograms are like time-stamped diaries of an earthquake. By examining the pattern of waves, scientists can identify the type of seismic waves arriving:

- Primary waves (P-waves): The fastest; compress and stretch the ground like sound waves. Arrive first and travel through solids, liquids, and gases.
- Secondary waves (S-waves): Slower; shake the ground side-to-side and only move through solids.
- Surface waves: Move along the planet’s surface (Love and Rayleigh waves); usually slower but cause the largest, longest-lasting shaking.
The staggered arrival of these waves on a seismogram allows seismologists to tell not only how strong the quake was but also the structure of the geological area it passed through.
Triangulating the Tremor: Pinpointing Epicenters
Locating a quake’s source is like solving a puzzle. By comparing the difference in arrival times between P-waves and S-waves recorded at a seismic station, scientists can estimate their distance from the epicenter.
- One station gives a radius—a circle where the quake could be.
- Two stations give two circles that intersect in two possible points.
- Three or more stations pinpoint the quake’s exact location through triangulation.
This method is fast and accurate, making it essential for emergency response and early warning systems.
Echo of the Earth: Wrapping Up
Seismographs are like the planet’s stethoscope, listening carefully to the subtle and dramatic movements beneath our feet. By using inertia, three-axis sensing, and wave analysis, they turn invisible tremors into data we can see, study, and act upon. From the first rumble to detailed seismic maps, these precise tools help scientists and safety officials respond quickly—and give us a front-row seat to the Earth’s incredible energy.


