
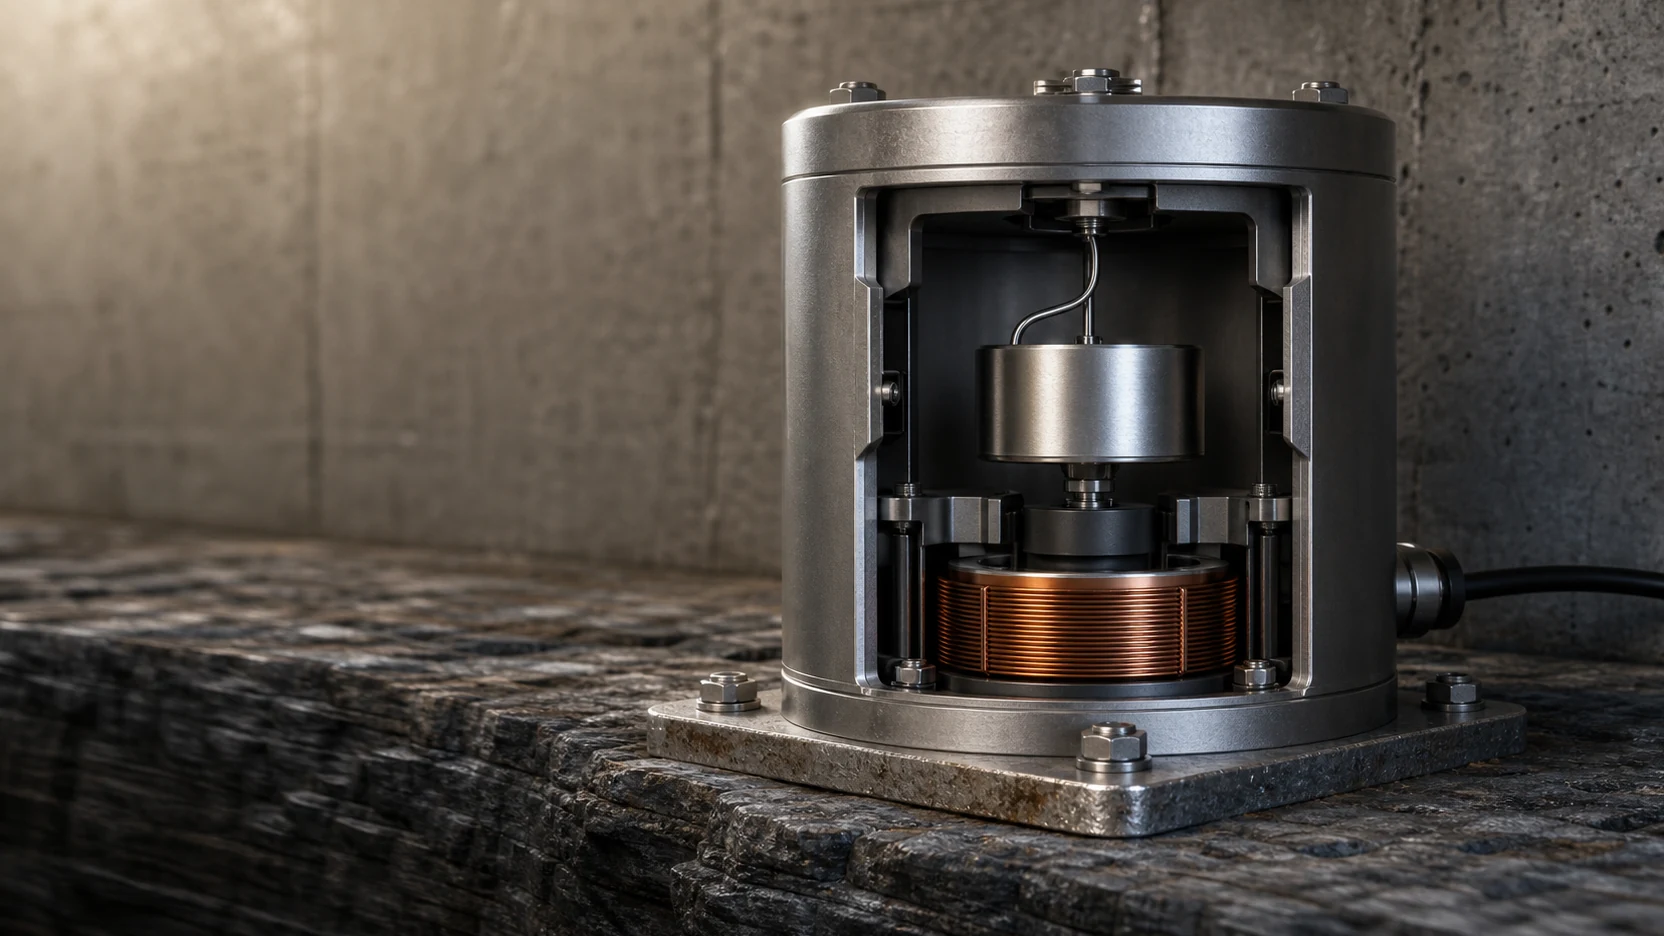
Quick Answer:A seismograph detects earthquakes by exploiting inertia: a heavy mass suspended from a frame stays still while the ground — and the frame — moves during an earthquake. Sensors measure the relative motion between the two, convert it into electrical signals, and record a seismogram that shows the strength and timing of the shaking.
The inertia principle
Seismographs rely on one simple physical fact: an object at rest tends to stay at rest. Inside the instrument, a mass hangs from a frame (often as a pendulum or mass-spring system) attached to the ground. When seismic waves arrive, the frame moves with the Earth, but the suspended mass resists moving because of inertia. Therelativemovement between the stationary mass and the moving frame is exactly the ground motion the instrument is designed to measure.
From motion to data
That relative movement must become a recordable signal. In older mechanical instruments, a pen attached to the mass traced wavy lines onto paper wrapped around a slowly rotating drum. In modern digital seismometers, electronic sensors convert the motion into electrical signals that are sampled, stored, and transmitted — which is why seismic data from stations around the world can be combined within seconds of an earthquake.
Three-axis detection
Ground motion is not a single direction. Earthquakes shake vertically and horizontally at the same time, so a modern seismometer contains three sensors oriented at right angles to each other:
- Vertical (Z)— up-and-down motion
- East–West (E)— horizontal motion in one direction
- North–South (N)— horizontal motion in the perpendicular direction
Recording all three axes captures the complete picture of the shaking, letting seismologists measure both how strong the quake was and how the ground moved.
Reading the seismogram: seismic waves
A seismogram is a time-stamped record of an earthquake. Its pattern reveals the different kinds of seismic waves, which travel at different speeds:
- P-waves (primary).The fastest; they compress and stretch the ground like sound waves, arrive first, and travel through solids, liquids, and gases.
- S-waves (secondary).Slower; they shake the ground side-to-side and only travel through solids.
- Surface waves.Love and Rayleigh waves travel along the planet's surface; they are usually slower but produce the largest, longest-lasting shaking.
The staggered arrival of these waves tells seismologists a great deal — not just how strong the quake was, but what kind of rock the waves passed through on their way to the station.
Triangulating the epicenter
Locating an earthquake's source is a matter of comparing clocks. P-waves and S-waves leave the epicenter at the same moment but travel at different speeds, so the gap between their arrivals at a station reveals how far away the quake was:
- One station gives a distance — a circle of possible locations.
- Two stations give two circles that intersect at two possible points.
- Three or more stations pinpoint the epicenter through triangulation.
This method is fast enough to support emergency response and early-warning systems. TheBritish Geological Surveyand theUSGS Earthquake Hazards Programboth explain how instrument networks turn these measurements into the alerts people rely on.
The bottom line
A seismograph is a motion detector built around a deliberately unmoving mass: inertia holds the mass still while the ground moves, sensors convert the difference into signals, and the resulting seismogram records the earthquake's fingerprint. Networked together and triangulated, these instruments turn invisible tremors into the data behind earthquake science and early warning.
Sources & further reading
That’s the mechanism. The wonder is still allowed.